IC Markets Home Sign in Web Trader Contact Us
IC Markets Social IC Markets Social

مركز المعلومات
للمتداولين الجادينs

  • ABOUT US
  • OPEN LIVE ACCOUNT
  • OPEN DEMO ACCOUNT
  • TRADE NOW
  • VISIT OUR BLOG
IC Markets Social
  • ABOUT US
  • OPEN LIVE ACCOUNT
  • OPEN DEMO ACCOUNT
  • TRADE NOW
  • VISIT OUR BLOG
October 2, 2024European_Indexes_esIC Markets

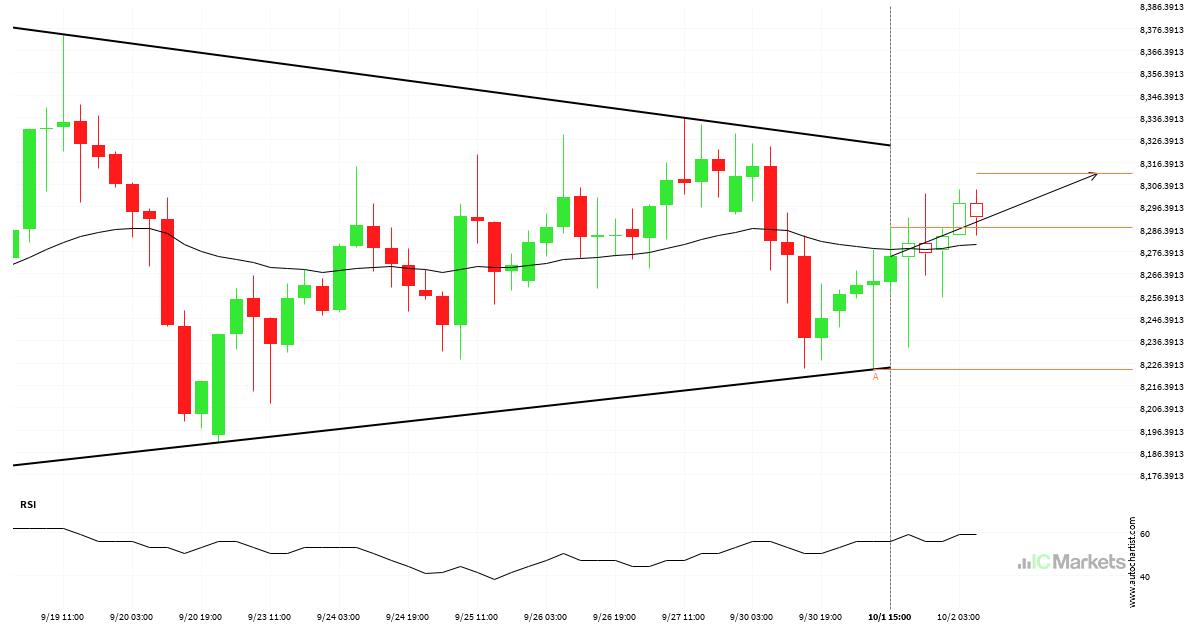
Inminente recuperación o irrupción del UK 100 Index

El UK 100 Index se dirige hacia la línea de resistencia de un Triángulo y puede alcanzar este punto en las próximas 2 días. Ha probado esta línea ya en numerosas ocasiones en el pasado, y esta vez no tendría porqué ser diferente y terminar con una recuperación en lugar de una irrupción. Si ésta […]

Read more
October 1, 2024European_Indexes_esIC Markets

France 40 Index se está moviendo, actúe ahora

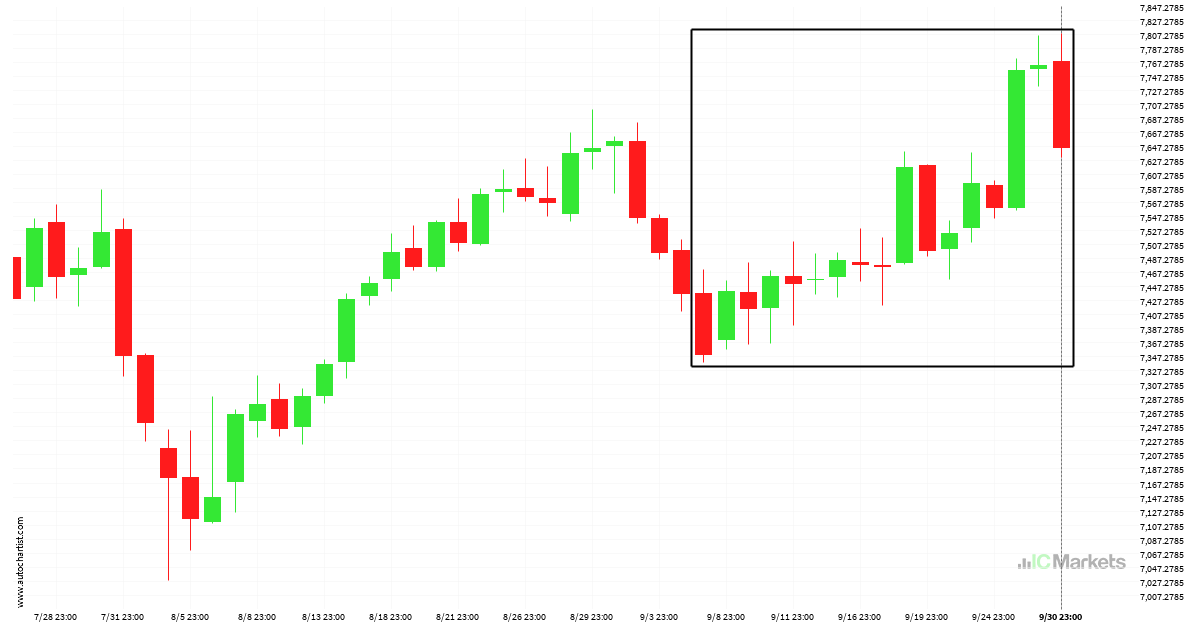
France 40 Index llegó a 7648.05 después de un movimiento del 4,07% que ha durado 26 días.

Read more
September 30, 2024European_Indexes_esIC Markets

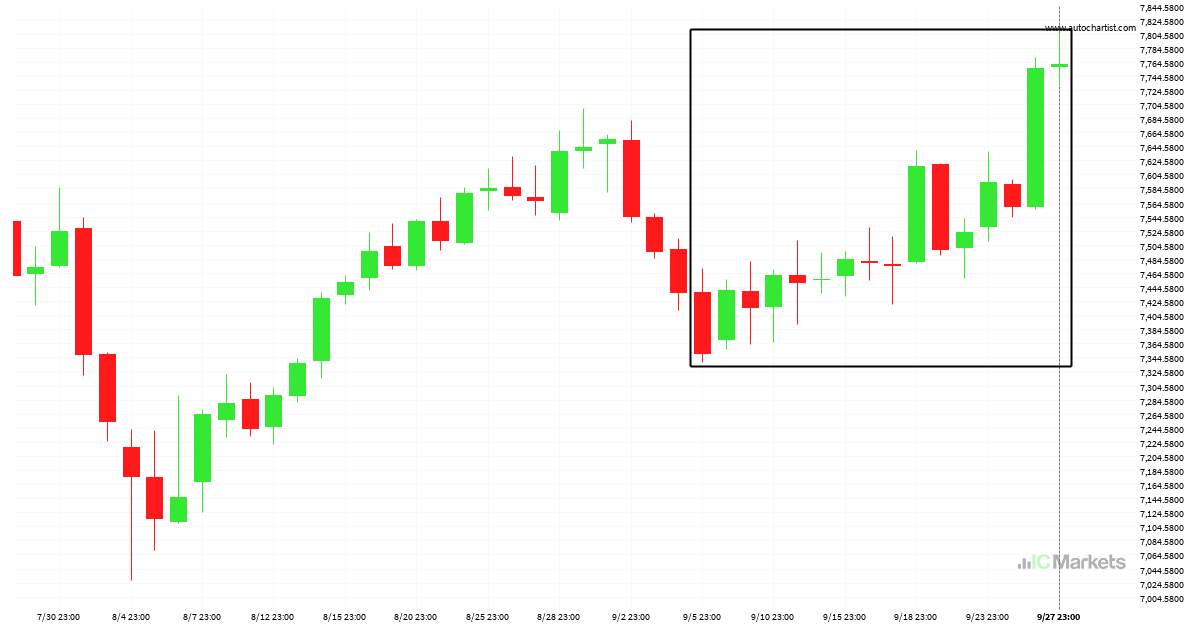
¿Es probable que France 40 Index corrija después de este gran movimiento?

France 40 Index ha subido un 5,62% desde 7349.2 hasta 7762.55 en los últimos 23 días.

Read more
September 26, 2024European_Indexes_esIC Markets

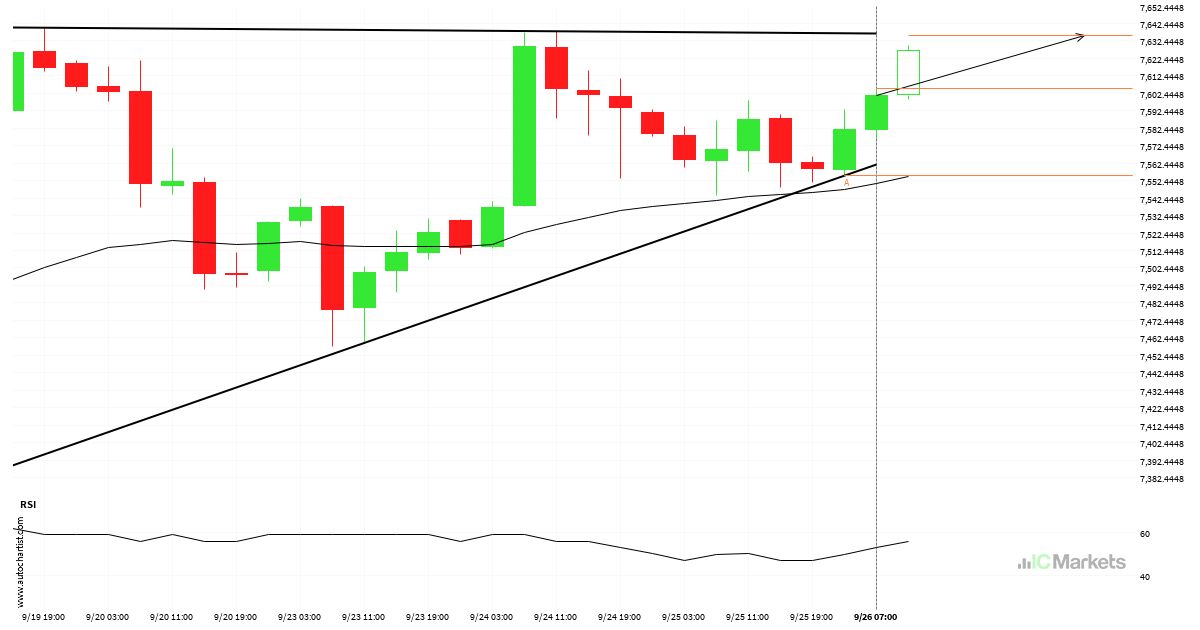
France 40 Index – Continuation Patrón de gráfico – Triángulo ascendente

Se detectó un patrón de Triángulo ascendente emergente en France 40 Index en el gráfico de 4 Hora. Hay un posible movimiento hacia 7635.7375 en las próximas velas. Una vez que alcance el nivel de soporte, puede continuar su movimiento alcista o retroceder a los niveles de precios actuales.

Read more
September 25, 2024European_Indexes_esIC Markets

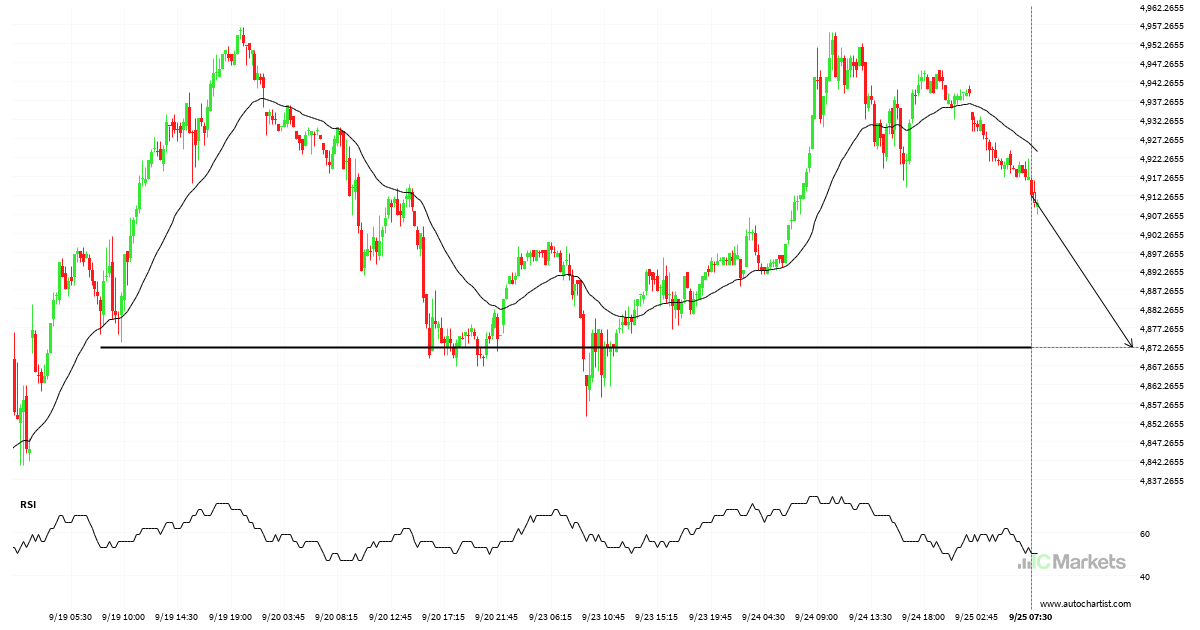
EU Stocks 50 Index: plan para operación bajista a corto plazo hasta 4872.0400

Se identificó un fuerte nivel de soporte en 4872.0400 en el gráfico de 15 Minutos de EU Stocks 50 Index. Es probable que EU Stocks 50 Index lo testee pronto.

Read more
September 17, 2024European_Indexes_esIC Markets

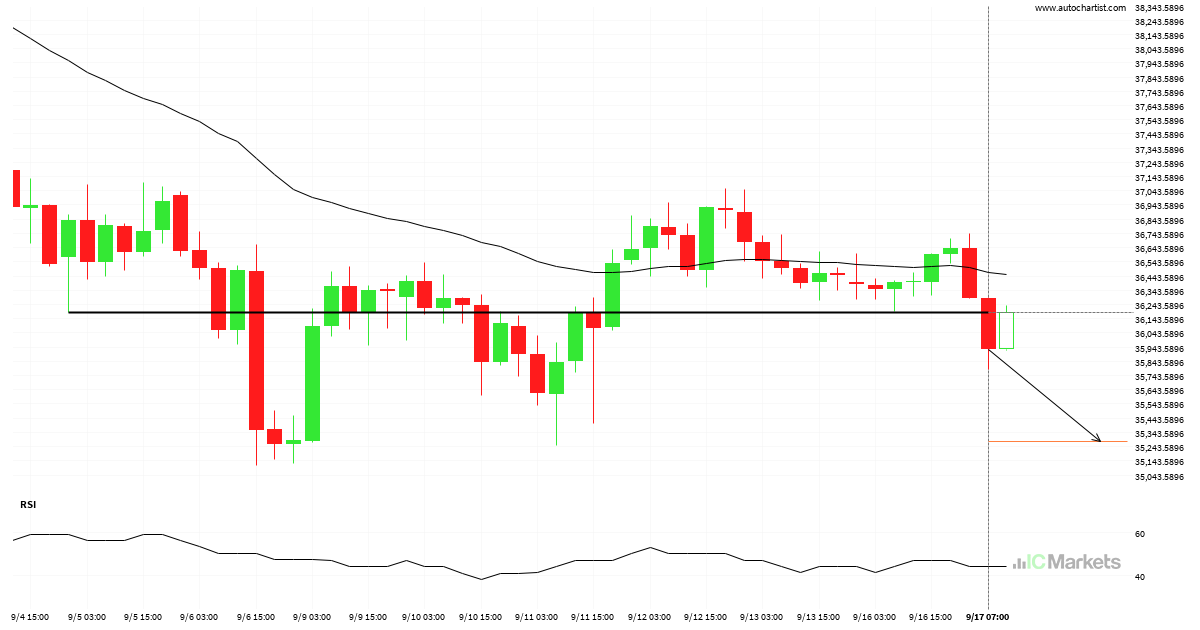
Japan 225 Index: línea de soporte rota a las 2024-09-17T03:00:00.000Z

El Japan 225 Index atravesó una línea de soporte. Ha entrado en contacto con esta línea en numerosas ocasiones en los últimos 13 días. Esta irrupción muestra un movimiento potencial hacia el nivel de 35280.8516 dentro de las próximas 2 días. Ya hemos observado un retroceso desde esta posición en el pasado, por tanto, debemos […]

Read more
September 16, 2024European_Indexes_esIC Markets

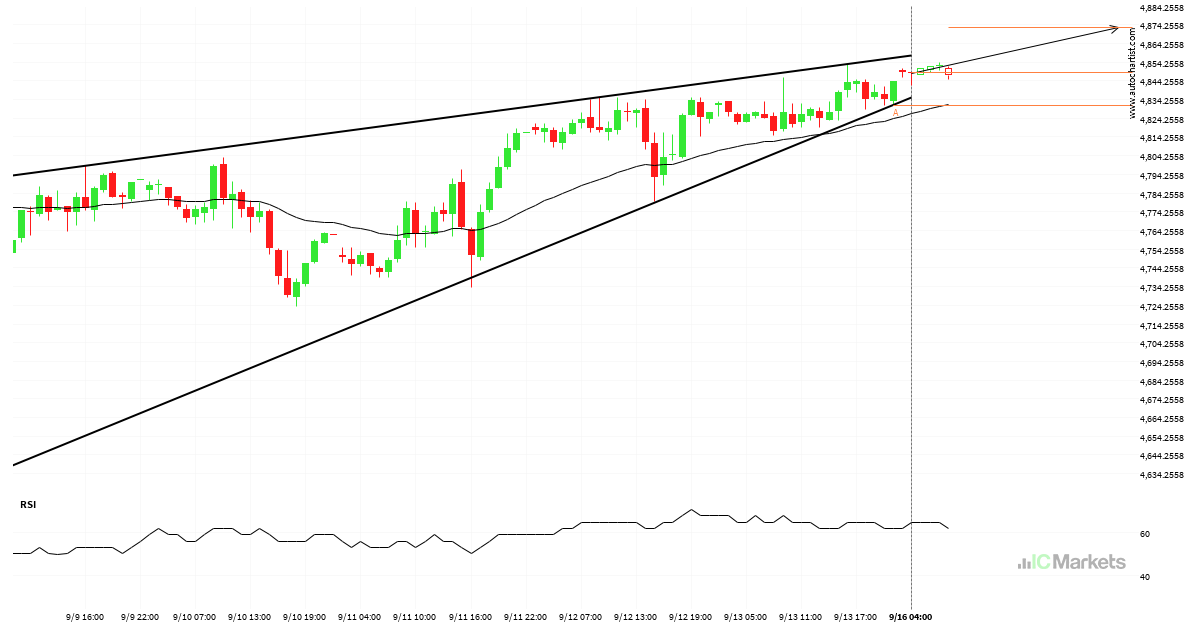
Posible ruptura del nivel de resistencia en el EU Stocks 50 Index

El EU Stocks 50 Index se está acercando a la línea de resistencia de un Cuña ascendente. Ha llegado a esta línea en numerosas ocasiones durante los últimos 10 días. Si vuelve a probarla de nuevo, debería hacerlo en las próximas 2 días.

Read more
September 12, 2024European_Indexes_esIC Markets

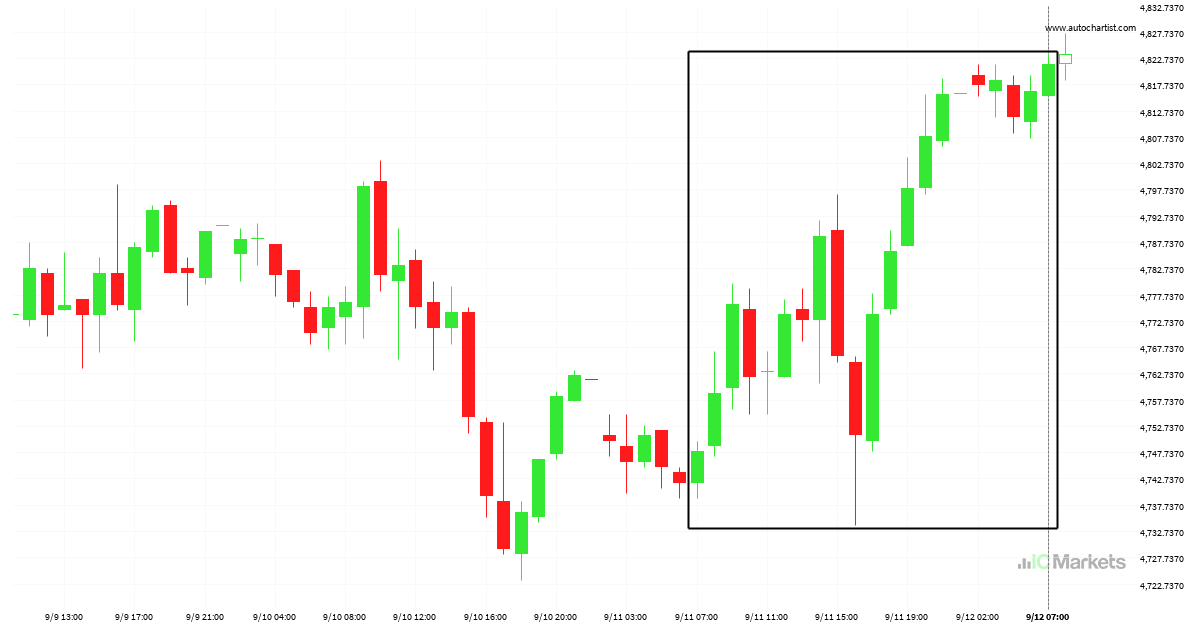
¿Qué está ocurriendo con el EU Stocks 50 Index?

El EU Stocks 50 Index ha experimentado un excepcional movimiento ascendente de un 1,66% de 4742.96 a 4821.53 en 2 días.

Read more
September 11, 2024European_Indexes_esIC Markets

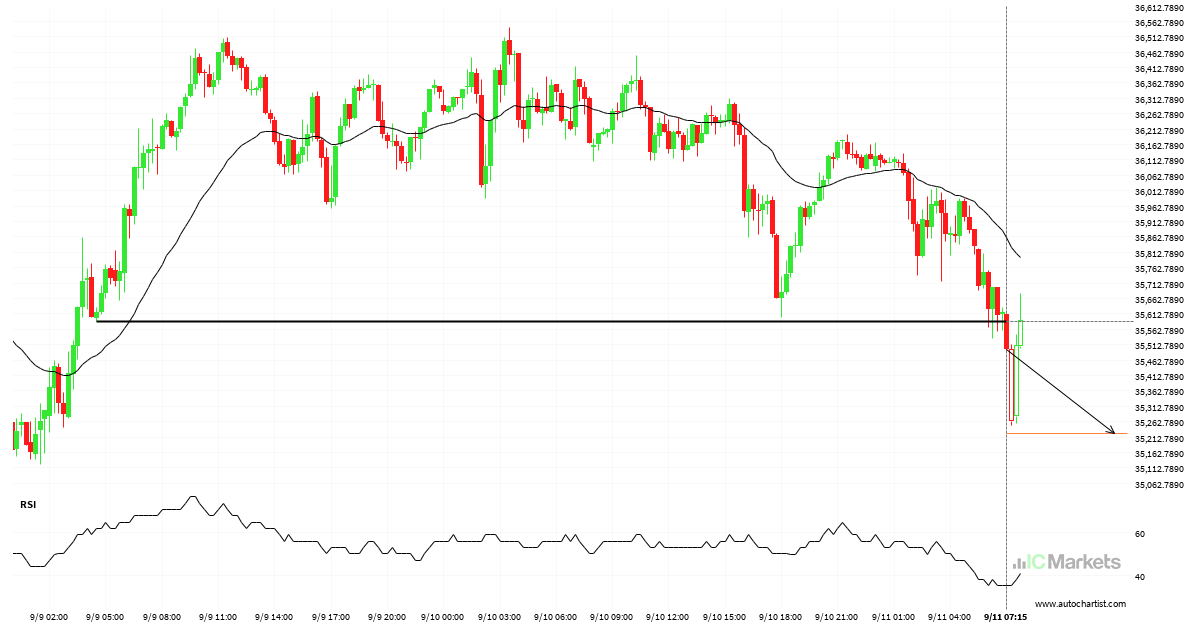
Rotura de Soporte en Japan 225 Index

Japan 225 Index ha roto la línea de soporte en 35587.8086. Puede continuar la tendencia bajista hacia 35224.4023 o puede resultar ser otro testeo más de este nivel.

Read more
September 6, 2024European_Indexes_esIC Markets

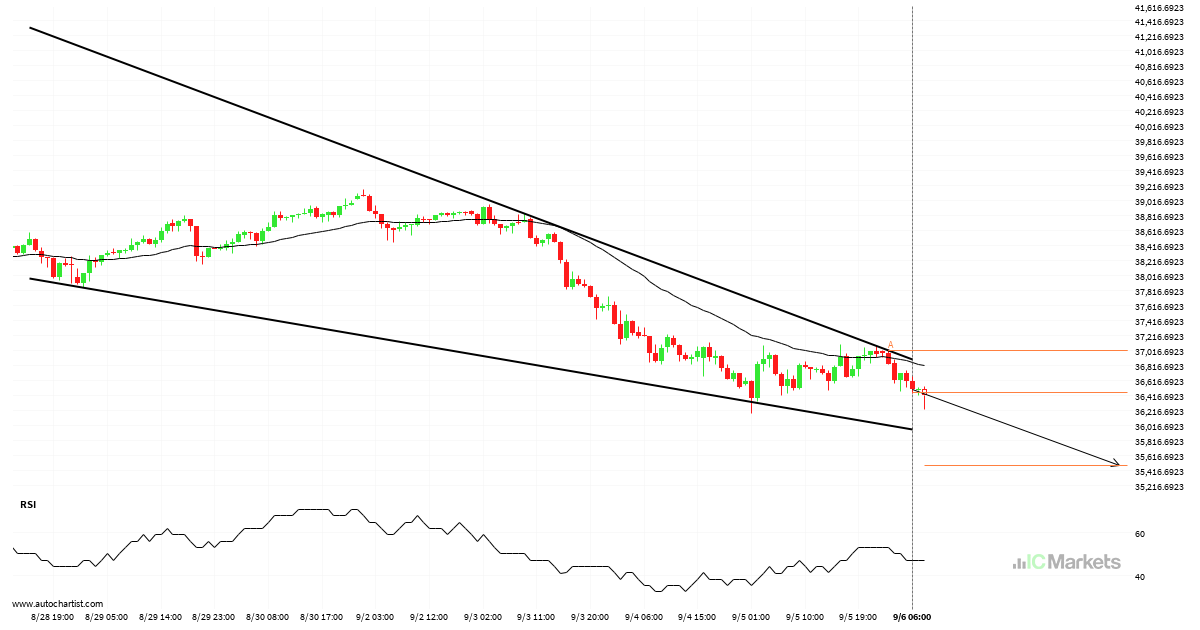
¿Tendrá el Japan 225 Index suficiente impulso como para irrumpir el soporte?

El movimiento del Japan 225 Index hacia la línea de soporte de un Cuña descendente es otra prueba más de la línea que ha alcanzado en numerosas ocasiones durante el pasado. Esta prueba de la línea podría ocurrir en las próximas 2 días, pero no sabemos si dará como resultado una ruptura a través de […]

Read more
  • 1
  • 2
  • 3
  • …
  • 6
  • 7
  • 8
  • 9
  • 10
  • 11
  • 12
  • …
  • 88
  • 89
  • 90

Recent Posts

  • US Wall Street 30 Index – المستوى الرئيسي – مقاومة
  • Brent Oil vs US Dollar – نموذج الرسم البياني – قناة صاعدة
  • Brent Oil vs US Dollar – نموذج الرسم البياني – قناة صاعدة
  • Hong Kong 50 Index – نموذج الرسم البياني – مثلث صاعد
  • Hong Kong 50 Index – รูปแบบกราฟ – สามเหลี่ยมขาขึ้น

Recent Comments

    Translation


     Edit Translation

    فتح الحساب وتمويله بشكل فوري

    تداول خلال دقائق!

    ابدأ اختبر حساب تجريبي مجاني

    نبذة عن IC Markets Global

    • مركز المساعدة
    • لماذا تختار IC Markets Global؟
    • التنظيم
    • الوثائق القانونية
    • اتصل بنا

    مواصفات التداول

    • الفروقات والعمولات
    • مجموعة المنتجات
    • ساعات التداول
    • التمويل
    • السحب

    تداول الفوركس

    • استعراض الحسابات
    • افتح حساب
    • إطلاق Web Trader


    Forex Trading

    • Accounts Overview
    • Open an Account
    • Launch Web Trader

    Trading Specifications

    • Spreads and Commissions
    • Range of Market
    • Trading Hours
    • Funding
    • Withdrawal

    About IC Markets

    • Chat with a Specialist 24/7
    • Why IC Markets
    • Regulation
    • Legal Documents
    • Contact Us

    IC Markets Global هو الاسم التجاري لشركة Raw Trading Ltd، التي تخضع لرقابة هيئة الخدمات المالية في سيشل (FSA) برقم ترخيص تاجر الأوراق المالية SD018.

    تحذير من المخاطر: ينطوي تداول الفوركس وعقود الفروقات على مخاطر عالية على رأس المال، لذا يُنصح بالتداول فقط بالأموال التي يمكنك تحمل خسارتها. قد لا يكون تداول الفوركس وعقود الفروقات مناسبًا لجميع المستثمرين، لذا يُرجى التأكد من فهمك التام للمخاطر المُحتملة، وطلب استشارة مستقلة عند الحاجة. يُرجى قراءة بيان إفصاح المخاطر والتأكد من فهمك التام له.

    الدول المحظورة : لا تقدم شركة Raw Trading Ltd خدماتها لسكان دول معينة مثل الولايات المتحدة الأمريكية وكندا والبرازيل وإسرائيل ونيوزيلندا وإيران وكوريا الشمالية (جمهورية كوريا الشعبية الديمقراطية) أو دولة يكون فيها مثل هذا التوزيع أو الاستخدام مخالفًا للقانون أو اللوائح المحلية.

    يجب أن تكون قد بلغت الثامنة عشرة من عمرك، أو السن القانوني المحدد في بلدك. بتسجيلك حسابًا لدى شركة رو تريدينج المحدودة، فإنك تُقر بأنك تُسجل بمحض إرادتك، دون أي تحريض من جانب Raw Trading Ltd .

    لا تُوجِّه Raw Trading Ltd موقعها الإلكتروني وخدماتها لأي فرد في أي دولة يُحظر فيها استخدام موقعها وخدماتها بموجب القوانين أو اللوائح المحلية. عند الوصول إلى هذا الموقع من دولة قد يُحظر فيها استخدامه، تقع على عاتق المستخدم مسؤولية ضمان توافق أي استخدام للموقع أو الخدمات مع القوانين أو اللوائح المحلية. لا تُقرّ شركة Raw Trading Ltd بأن المعلومات المتوفرة على موقعها الإلكتروني مناسبة أو صالحة للاستخدام في جميع الولايات القضائية.

    الوثائق القانونية

    © 2022 Raw Trading Ltd | All rights reserved.
    • Sample Page